The ‘New’ Economy

Economics must adapt to structural deficiencies affecting both businesses and workers; Deficiencies that itself created.

This was written in May of 2020, at the heights of the pandemic – certainly things have changed:

Friday morning, May 8th the Labor Department released its monthly employment data. It was the darkest monthly employment figures on record. Through the March and April job reports, 21.4 million Americans lost their jobs1.Between 2010 and February of 2020, the United States created almost 22.7 million jobs2. With many continuing to file for unemployment, the decade plus of job creation following the 2008 financial crisis will be wiped out in a little under 3 months. To visualize this, The New York Times ran their frontpage section showing the monthly employment figures. April’s 20.5 million lost jobs runs the entire length down the paper. An important statistic to you, the reader; 1 in 4 people between 20 to 24 years old are unemployed3. This pandemic has a disproportionate effect for many Americans across the income spectrum. The vast majority of Americans that work in the services industry have either felt the brunt of a layoff or been furloughed, or fortunate to continue working, but in an ongoing and ever elusive health crisis that’s evolving faster than employers can prepare. Many are worried about unpaid bills, job security, or fighting the labyrinth of our country’s antiquated welfare programs. For the few in the top percentile of the income bracket, whose pay is tied more to the stock market, the story is much different. Snap Inc., the parent company of the popular social media app worth approximately $20B, rose almost 10% in value the week before the horrific data was released by the Labor Department4. That week, Evan Spiegel, the co-founder and CEO of Snap Inc., sold almost 4 million shares, worth $55 million5. Evan owns over 10% of the total company, and through a dual share-class ownership structure similar to that of Google or Facebook, Evan owns 54% of the voting-rights (actual decision-making rights of a company). His co-founder, Bobby Murphy, owns the other 46% of the voting rights6. I hope you go back and re-read those two sentences. Note that a company worth $20B owned by many individuals fortunate enough to have a 401K, or dumb enough to trade the stock on Robinhood, or engineering and software developers at his company, have 0% right or say in the company’s business. You can spend billions of dollars trying to buy the company outright, but even then you can’t change the policy that notifies users on Snapchat when their snaps are screenshotted. You would need Evan’s shares to do that. This goes against what you are taught in undergraduate economics. If you buy a company, you control it. The unique dual share-class structure arising in tech companies blows this idea out of the water. Instead, one individual, like Evan Spiegel, has essentially the entire say of what goes on at the company; complete power.

The vast majority of us make our living off of wages. Wages that were created by jobs, like those who were hired in the last decade. The jobs created were waiters and waitresses paying off student loans. Some are trying to support their family through unforeseen circumstances. Others take on jobs in the summer to gain life or career experiences and move out of their hometowns. These jobs, albeit lower-pay, have evaporated. This eliminated a way for them just to make ends meet. Meanwhile, the Evan Spiegel type makes a living off of selling his company’s stock, to the tune of millions of dollars. That is how he, along with others in an exclusive slice of the top 1%, make a living. According to a study conducted by the Congressional Research Service, real wage trends (wages adjusted for inflation) for the median worker has increased just 6.1% cumulatively over the course of nearly 40 years, from 1979-20187. Over that same time period, the real S&P 500 return (adjusted for inflation) is 2,005.5%8. That means the majority shareholders of companies, the wealthy, and a small slice of the population, have gotten exponentially more wealthy in the past 4 decades. While the vast majority of Americans haven’t. You can dive deeper into these trends, slicing data by demographics, by age, by zip code, etc. You will find even more worrying problems. This topic, inequality, has been covered at length by many labor economists. Notably, Raj Chetty, a distinguished young economist at Harvard. His work has covered “The American Dream” that is, upward economic mobility. Paul Krugman, the Nobel prize winning economist and columnist, won his Nobel prize covering international trade. He helps breakdown attributes like technological innovation and globalization as factors that have both benefited consumers, but also contributed to income inequality. Thomas Piketty, the Nobel prize winning french economist, wrote “Capital in the 21st Century” which was an immersion and historical analysis based on European and American inequality since the 18th century. Despite the economists like Raj Chetty, Paul Krugman, and Thomas Piketty contributing mightily to the economics profession, their influential work on their respective subjects isn’t disseminated to the masses. Meanwhile the influential economists like Milton Friedman, Paul Samuelson, and Eugene Fama have had their work circulated and carved into the founding frameworks of Economics 101 and courses taught at almost all education levels. Whether you paid attention in class or not, these economists’ work were what you were learning. 

This isn’t to knock against capitalism, it’s worked great to build America, employ millions, and lift everyone’s standard of living. This isn’t an ode to communism either, labor needs businesses to succeed too. Company’s earnings haven’t kept pace with their own valuations in the stock market. Corporate earnings since 1989 have increased 592%, far better than median worker, but keep in mind S&P 500 returns have increased almost 4x that amount9. It is more pronounced when you look at the last decade. Corporate earnings have increased 30%, that is in comparison with the 192% increase in the S&P 50010. Before 1989, the trend was flipped; corporate earnings far outpaced stock market returns. The company that Evan Spiegel runs, Snap Inc., hasn’t been profitable its entire existence11. There are plenty of companies out there where this is the same case. It is easier for labor to demand a fairer share of corporate profits when they have increased dramatically. But they haven’t, it is much harder for labor to argue for better wages, which remain stagnant for decades when shareholders’ gains have outpaced our own economy. This is what the Occupy Wall Street movement should’ve been about. And companies’ management teams’ explanations are understandable. They are doing what they were taught in business school; maximize shareholder’s wealth. As pointed out, they’re doing an extremely good job of that. That’s how they retain their job. It’s what was taught by the works of Milton Friedman, Paul Samuelson, and Eugene Fama. If only they were taught the lessons of Raj Chetty, Paul Krugman, or Thomas Piketty, that the data on inequality wouldn’t be so stark. 

___________________________________________________________________

References:

Historical employment information was obtained by the Bureau of Labor Statistics. 

https://www.bls.gov/news.release/empsit.nr0.htm

https://data.bls.gov/timeseries/CES0000000001?output_view=net_1mth

The New York Times front page for May 8th, 2020 can be found here, this is also where the unemployment data by age can be found. 

Data referencing Snap Inc. can be found below:

The congressional research report covering stagnant wages can be found here

S&P 500 return information and corporate profit information can be found below:

http://www.econ.yale.edu/~shiller/data.htm

https://fred.stlouisfed.org/series/CP

Guiding Articles

https://www.theatlantic.com/business/archive/2016/09/why-so-few-american-economists-are-studying-inequality/499253/

https://www.axios.com/most-jobs-created-since-recciu-1536269032-13ccc866-5fb0-44e8-bd14-286ae09c296f.html

Bye, for now

Bye Alleyway Investing,
I started Alleyway Investing in 8th grade, I wrote about the market, recent news and developments and portrayed my learning and passion for investing. So after more than 6 years I’ll be shutting it down. The plan comes after I’ve been abroad and will be taking this semester from school off to focus on my new endeavor. 
Alleyway Investing provided me a way to express my opinion on the market and deliver market commentaries when I could. Over the years and primarily in college I began to take a more research oriented approach. It was after a discussion with a friend of mine that I realized the market commentary I was use to producing along with the weekly forecasts and stocks of the week posts were more useful than I thought. So I’ve been reconsidering in my new endeavor going back to this. For my readers from all stages of Alleyway Investing, from the .webs.com in the early days, to .blogspot.com to just alleyway investing, I thank you. And I hope you will enjoy and follow my new site, as I’ll combine the basics that I grew up writing about, with the new developments and advancements I’ve been learning about.
Starting this Fall I am opening up a new blog and fund under the umbrella of Stochastic Management. Through Stochastic’s Blog and the Stochastic Fund, I will be delivering my take on the markets blogging about what’s on my mind and my interests, along with a fund I’ll be managing that’s objective is to track my ever growing investment philosophies that are portrayed through my thoughts and reasons on the blog. It’s open to outside investors and for more information, it would be worth checking out http://www.stochasticmanagement.com

From Day 1 Readers to Newcomers and All In Between,
Thank you. 

Jon Morris 

Want to see a page out of Warren Buffet’s playbook?

Here’s an interesting piece of information regarding Warren Buffet’s investing style.

For the uninitiated of ultra-Warren Buffet fans, his investing style can be described as a much more polished version of Benjamin Graham’s value investing. If Ben Graham played basketball he’d be Dr. J, while Warren Buffet would be Michael Jordan. Now in this analogy I can’t tell you how to perfect Michael’s signature turn-around fade away, but I can tell you a sneaky dribble move he use to pull to get open.

Warren Buffet believes in fundamental investing, something that these days of computer algorithms and index investing is becoming out-of-style and prehistoric. But hear me out on just one example.

I think Warren would like this one:

Target

The timeline for Target Corp. imploding data breach of over 40 million Americans phone numbers, addresses, credit and debit cards was around late November of 2013.

In the aftermath of the data breach Target met with state attorneys and the justice department and did internal evaluations on just how much from a monetary value did Target customers lose in fraud.

The fraud couldn’t have come at worse time, late November/December or the end of Q4 is crucial time for retailers to ramp up sales in time for the holiday season. Depending on the retailer, this time period can make or break a companies yearly revenue stream.

Sure this will hurt Target in Q4 of ’13 and you can see that as transactions fell 3-4% compared to the holiday season a year earlier. But this is Target, a massive grocery store chain that consumers rely heavily on for day-to-day shopping needs (my dad as an example). So looking at this from an investors point of view a promising time to invest in Target may have come up with the great power of hindsight.

So how did the stock react during this time?

In clarification, the time period is from the time Target announced the data breach publicly (December 19th, 2013) to when their CEO Steinhafel resigned (May 5th, 2014)

The S&P 500 as a benchmark during the time period produced a 4% return while Target produced a -3% return, under performing the benchmark by 7%. 

So where does Warren Buffet play in all of this?

A part of value investing that can be intuitively inferred is the value part. The data breach for target was unfortunate and the timing of it gave the company bad publicity during the holiday season. However what fundamentally changed in the stock? 3-4% transaction loss, which did fundamentally hurt the company, but is that a sustainable (or permanent) loss?

Sure, this hurts Target’s brand (which is apart of its value) its just hard to put a monetary amount on it, wait why not? Lets put the value at however much sales it lost as a result of the subsequent reaction to the data-breach. The reaction of its stock price (a 7% under performance) Buffet would argue does not correlate with the fundamental loss of the company.

Remember, this isn’t a company heavily reliant on 4th quarter sales (although it is a factor) I would consider Target up there below Dollar Tree as a non-cyclical consumer staple. 

So the question is, if you invested after CEO Steinhafel ‘s resignation, how would you have done?

Quite well.

The S&P 500 has produced a 13% return to-date from CEO Steinhafel’s resignation

Target has produced a 28% return to-date from CEO Steinhafel’s resignation

That is an out performance of 15%

Warren would like this kind intuitive investing a lot. Value Investing Is Not Dead.


Interest Rate Project – Update

Last summer I created a portfolio that in my belief would benefit from or in particular outperform set of benchmarks from an interest rate increase by the Federal Reserve. After 9 months I’ve decided to revisit and touch upon the current market environment.


An Ill-Advised Stone Cold Monetary Policy

This project was to test how a chosen portfolio will react to an increase in interest rate hikes and since none has come the projects timeline will have to change. The environment around the world has been one of perplexity. So obviously the portfolio is not poised to perform well in low-interest rate environments. The Federal Reserve has constantly been saying over the course of Janet Yellen, the Federal Reserve Chairwoman, tenure that the their are two data-driven economic stats that the “transparent” Federal Reserve uses to help determine changes in the federal funds rate. The Dual Mandate is what was passed in the 1970s for the Federal Reserve’s dual purposes:

Full employment

Inflation target at 2%

These two pieces of economic data were to be monitored carefully and were made known through the Federal Reserve’s meeting minutes and statements and Janet Yellen’s testimonies that an interest rate movement would be dependent on these two factors. I am well aware other factors come to play, especially other central banks monetary policies, but by emphasizing full employment (which according to a post by the Federal Reserve of Cleveland is around 5-6 percent unemployment) and an inflation target of 2% it has mislead the general public to perceive these two factors were the leading pieces of economic data to go by for an interest rate increase.

According to a U.S. Bureau of Labor Statistics news release, unemployment levels have steadily decreased to 5% and even below 5% at the end of 2015.

According to a U.S. Bureau of Labor Statistics news release, the Consumer Price Index (CPI) widely known as the best tracker of inflation, has risen over 2% starting the beginning of 2016.

If you were to isolate these two pieces of data for making interest rate decisions, the federal funds rate should have moved up in the start of 2016. It is when you take a look at two other factors that have the Federal Reserve in a troubled spot.

Financial Markets

Global Interest Rate Environment

The general financial market downturn in late January to start the year in 2016 I believe was a mistaken motive or factor that drove the Federal Reserve to hold off raising the federal funds rate. The cardinal rule in economics is to not make monetary policy decisions based on the general market movements. This I believe was broken and caused a loop reaction that does not fair well for general economy. This terrible decision-making has led to the situation we currently have; the market is looking to the federal reserve for guidance, while the federal reserve is basing its decisions off of the market (in part).

The global interest rate environment has been unprecedented in the levels of extremely low interest rates and the innovations of negative interest rates in countries like Denmark, Sweden, Switzerland, and Japan. This has caused a strengthened dollar against many global currencies that has caused multi-national corporations trouble turning revenues from multiple currencies back into U.S. dollars. By the devaluation of many nation’s currencies along with the complexities of quantitative easing and negative interest rates in the global market place, it has driven the Federal Reserve to rethink raising the federal funds rate.

While this has fixed-income markets, it can be argued that the low-interest rate environment has led to inflated equity prices.

Looking Forward

Before going over the portfolio’s performance, I’d like to write a few words on what is expected for the portfolio looking forward.

This portfolio was passively managed. Meaning that after the weighting was set, there was no change in the portfolio’s weights. The portfolio will be reevaluated in the summer regarding weighting of the portfolio.

While this has been a medium-term project and my time-horizon was mistaken, I still am in firm belief that this project is still relevant. It may be a farther horizon date than previously stated, but will be updating from time-to-time on this project. Once the project hits a year old, there will be an update along with what is expected moving forward.

9-Month Performance

Here is how the portfolio has performed over the 9-month period:


Company % Of Portfolio Performance*
Regional Financial Corp. 12% -9%
East West Bancorp, Inc. 12% -14%
The Allstate Corporation 3% -3%
Commerce Bancshares, Inc. 6% -1%
Prudential Financial, Inc. 6% -11%
Marsh & McLennan Companies, Inc. 23% 6%
M&T Bank Corporation 35% -9%
BB&T Corporation 3% -12%
TOTAL PORTFOLIO 9-MONTH PERFORMANCE: -6%

*Dividends not included

Performance vs. Benchmarks

As stated in the Interest Rate Project, there are 3 benchmarks that this portfolio will be put against.

S&P 500

Leading Regional Bank ETF

Leading Regional Bank Mutual Fund

Here is the performance of the portfolio against the chosen benchmarks.

Portfolio Time Period Return**
Alleyway Investing Portfolio July 20th – April 22nd -6%
iShares U.S. Regional Bank ETF (IAT) July 20th – April 22nd -9%
John Hancock Regional Bank A (FRBAX)


July 20th – April 22nd -6%
S&P 500 July 20th – April 22nd -2%

**Dividends not included

It is understandable for this project to underperform the S&P 500 on measures that the low-interest rate environment, but outperformed the chosen regional bank ETF, and tied the chosen mutual fund, (but if include the mutual fund fees the chosen portfolio probably outperformed this benchmark as well).

For any questions, comments, concerns please email alleywayinvesting@gmail.com for more information.


How Did a Forbes Stock Picking Article Do in 2013?

Forbes posted an article on Twitter in December of 2012 titled “12 Stocks to Buy in 2013” but unlike normal spammy titles, it offered up the ideas of top advisors and today I take a look at how they did.

The Financial Markets in 2013

Its important to realize financial how financial markets did in relation to the ideas each investor states. So lets see just how good some of the top financial markets in the world faired in 2013:

Selected World Financial Markets 2013 Performance
Dow Industrials 26.50%
NASDAQ 34.38%
S&P 500 29.09%
FTSE 100 14.13%
DAX 24.22%
Shanghai -7.88%
Nikkei 225 53.63%
Hang Index 1.68%

The first takeaway from this is if each advisor indicates a certain stock simply put its returns against the average of the market it is in. That way a fair conclusion can be drawn. This is because if an advisor chooses a stock that returned 28% in the S&P 500, that return may look robust but compared to the markets return, the S&P 500 did better, in which case you would have been better off investing in an index fund.

The second takeaway is in 2013 a majority of the major financial markets showed strong performances. The average of the selected financial markets listed above is 26.23% (excludes the Shanghai Index) even with the underperforming Shanghai Index, the average is 21.97%.

The Financial Advisor’s Selected Stocks Performances

The average return of these advisors (which included a currency, and ETF recommendation) was 17.12%, without the currency or ETF returns the average would be  19.38% still underperforming the financial markets.

The Results

James O’Shaughnessy, O’Shaugnessy Asset Management

  • Northrop Grumman 70.40% vs. S&P 500 29.09%

The article states fundamental components why Northrop Grumman would have a successful year and proved right, outpacing the S&P by 41.31%

Jim Oberweis, Oberweis Funds

  • HMS Holdings Corp. -14.32% vs. NASDAQ 34.34%

A company that provides cost avoidance services to government healthcare programs wouldn’t fair well in the environment under the Affordable Healthcare Act.

Ken Fisher, Fisher Investments

  • Pfizer 22.17% vs. S&P 500 29.09%

A logical investment with such a large pharmaceutical and a good dividend yield, although it underperformed the market and there are other more names in the healthcare field (like biopharmaceutical) Pfizer would be a longer term holding.

Dan Chung, Fred Alger Management

  • The Fresh Market -12.29% vs. NASDAQ 34.38%

With such a competitive marketplace, high-end specialty grocery stores that don’t have a strong presence (like The Fresh Market) will have a hard time gaining a percentages of the market share.

Ryan Crane, Stephens Investments Management

  • Acacia Research -44.17% vs. NASDAQ 34.38%

Don Yachtman

  • Procter and Gamble 22.38%  vs. S&P 500 29.09%

A predictable business model with long standing products and a good dividend yield, like Pfizer a good dividend yield and although another underperforming stock, a better long term investment.

Berry Ritholtz, FusionIQ

  • Healthcare SPDR 9.85% (Symbol XLV)

Investing in healthcare ETF in 2013 only makes sense intuitively because of the industry, but with a fund holding Johnson & Johnson, Pfizer, and other large pharmaceuticals  doesn’t truly divert the risk, only limits the returns. Investing in a household pharmaceutical company would be able to obtain a better return at almost the same risk.

Robert Kleinschmidt, Tocqueville Asset Management

  • Microsoft 43.70% vs. Apple 7.86%

The reason why the comparison is Apple is because Kleinshmidt was quoted in the Forbes article saying, “I’d rather own Microsoft, which is sort of the opposite of Apple. It’s just as cheap from a valuation perspective.” And he was right, Microsoft outperformed the market, and Apple by solid numbers.

Chuck Royce, Royce & Associates

  • Ethan & Allen Interiors 14.15% vs. S&P 500 29.09%

Martin Sosnoff, Atalanta Sosnoff Capital

  • GM 36.28% vs. S&P 500 29.09%

Sosnoff stated that the government still owned a significant stake in the company and that they weren’t looking to sell anytime soon. Government’s ownership in equities can help put a bottom to a stock, for example the Federal Reserve bailed out AIG and from March 9th, 2009 to now the stock price is up 1,016% according to Yahoo Finance adjusted historical prices.

Guy Spier, Aquamarine

  • Fiat 55.49% vs. S&P 500 29.09%

Jens Nordvig, Nomura Securities

  • Mexican peso 1.79%
Takeaway

The takeaway isn’t to automatically discount the financial advisors and just invest in an index fund, because you don’t know when the index fund will deliver solid gains, and some of these fund managers had better results with their stock picks than the market. Also it isn’t too fair to judge an advisor based off of just one pick, their investments could be sound and their entire portfolio could have beat the markets. When choosing a financial advisor, it comes down to their complete performance just as much as their approach.

Historical data gathered from Yahoo Finance, advisor & stock predictions gathered from Forbes.

The Government as an Economic Sector & Government Investments

Using the data from the U.S. Bureau of Economic Analysis on gross output per industry, a deeper understanding of government as an economic sector and its investments and has been conducted.

The Government as an Economic Sector

In an excerpt of the Bureau of Economic Analysis paper “Measuring the Economy”, they define the government sector as:

“General Governments. This sector receives revenues from taxes and other sources and uses these revenues to provide public goods and services, such as education and defense, and transfer payments, such as social security or Medicaid benefits. The sector includes Federal, state, and local government agencies, except for government enterprises.”

Deciphering this definition leaves us with what the exact sources are for the government revenues and expenditures listed are classified by the national income and public accounts.

  • Current taxes (Includes licensing fees like business licensing, drivers license)
  • Social insurance contribution (Includes social security, medicare, unemployment insurance, and other smaller programs)
  • Income receipts from government assets (Includes interest, dividends, and rental income, such as royalties paid on drilling on the outer continental shelf (deep-water drilling). Also, governments earn interest and dividend income on financial assets.*
  • Current transfer receipts (Includes grants, fines, fees, donations, unclaimed bank deposits, deposit insurance premiums, and tobacco settlements)
  • Current surplus (or deficit) of government enterprises (Government-sponsored enterprises or GSE are financial service corporations that attempt to increase the flow of capital to systems such as housing, veterans, farming, and education. They consistently run on a deficit.)

Here are the four main categories of expenditures.

  • Consumption expenditures (Including compensation, fixed capital, intermediate goods and services purchased among others)
  • Current transfer payments (Include social security, medicare, other income providing support such as Medicaid and food stamp benefits. Also includes federal aid to foreign countries and payments to international organizations like the United Nations)
  • Interest payments (interest paid to borrow their capital and operational costs)
  • Subsidies (Includes payments to businesses, homeowners, and government enterprises)
Commentary

I think it is important to show how our government operates financially. It may seem daunting and slightly paradoxical but our government is actually very transparent with its reports especially compared to other governments. Yet, as transparent as it is, it may seem pretty confusing. The NIPAs (national income and product accounts) released by the Federal Reserve shows in detail the revenues and expenditures of the government each year. And as important as I think it is, I only want to draw a couple conclusions from it so I can move onto the important piece I found from reading through the NIPAs.

Takeway

Kind of obvious, but the federal and states revenues and expenditures do not differ in percentages too much from each other, although the local governments do. Local governments revenues include larger portion coming from state government grants-in-aid and property taxes. On the expenditure side, consumer expenditures count for the vast majority of spending compared to the federal governments social benefits as the biggest spending unit. I do ask the question where is the military spending in all of this?

The Government Investments

This section I will go over what I found in the NIPAs and from a Janet Yellen testimony, as well as trying to confirm the hypothesis between a correlation in government’s gross expenditures and government issued investments.

The * explained.

If you read through the NIPAs in the above section you came across a * in the revenue section of income receipts on government assets. I believe this asterisk is important in determining the level of some investments in the financial markets. This may be common sense to some but is worth clarifying to show its importance.

The Federal Reserve holds securities in the financial markets.

That list of securities held by the Federal Reserve (should be released to public knowledge) is a key tool to use when investing. During the 2008 financial crisis the Federal Reserve, treasury, and bank leaders scrambled to put a relief to the financial industry in the form of cash into the financial markets. This liquidation which then came in the form of quantitive easing, gave the financial markets a safety net. The point is one of the largest held securities by the Federal Reserve must have been during the quantitative easing period (and possibly after) high institutional banks, or in other words, banks that have access to the overnight rate (federal funds rate). This list is available here.

What does the Fed invest in?

The Federal Reserve invests in low risk assets that are mostly held by government sponsored agencies, treasury notes, and TIPS. It is held by the Federal Reserve and managed in the System Open Market Account for the purpose of liquidity and essentially is the Federal Reserve’s emergency money.

A deeper look at the Fed’s portfolio including the investment banks that underwrite their securities will be mentioned in an article later, for now lets continue on our journey through government investments.

The Hypothesis

For those of you who did not read my Economic Statistics by Industry I showed the gross output by industry through statistics from the BEA (Bureau of Economic Analysis) and made a hypothesis stating the gross output of the government is related to government issued investments. So the point of this article was to test this hypothesis. After some background into the government as an economic sector, and some introduction into government’s investments lets define what I’ll be using as a “government issued investment”.

 The gross output provided by the BEA divided government into two subcategories; federal and state. I will be doing the same for their government issued securities.

Federal

Treasury bills, notes, and bonds are the most common securities that to me are defined as “government issued investments” and will be used to analyze the government’s gross output to the returns represented by the T-bills, T-notes, and T-bonds. It is important to realize I will not be taking into account another form of government issued investments in the form of GSE’s. The securities listed as agencies will not be used in this project because defined by the BEA’s definition of government as an economic sector they do not include GSE’s as part of their definition. I’m also not including government savings bonds.

State and Local

The way I define “government issued investments” for state and local governments is simply municipal bonds. Municipal bonds are the most direct way to invest in state and local governments. I will be using muni bonds against the state and local gross output for my project.

Conclusion

After giving some time to define the government in depth as an economic sector, and preview what I will be using to correlate the government’s economic output vs. the government’s investments, the only thing left to do is retrieve the data, punch some numbers and I will be reporting to you the results in the near future. This preliminary search was conducted to clearly define the project and hopefully give some insight and knowledge into the government from a financial perspective. During my findings I found some sidetracked search involving the Fed’s holdings and will also deliver an article diving deeper into that portion. Feel free to email alleywayinvesting@gmail.com for any questions and inquiries.

All data for this project was retrieved from the Bureau of Economic Analysis, Federal Reserve, and the Federal Reserve Bank of New York. 

Allocation of the Interest Rate Equities Project

A revised and more clear released weighting of the equities mentioned in the interest rate equities project.

Reasoning behind the weighting goes into a deeper look into the financial statements of each company. Net Income growth, expenses, and EPS growth, found in the companies 5-year financial statements.

The weighting is as follows:

MTB                                        30%

MMC                                       20%

PFBC                                       15%

RF                                            10%

EWBC                                      10%

CBSH                                      5%

PRU                                         5%

ALL                                        2.5%

BBT                                        2.5%

This allocation is subject to change on a weekly basis. And will be revisited pending Federal Reserve minutes, and/or other interest rate sensitive events.

Benchmarks

This portfolio will be put up against 3 benchmarks.

1. S&P 500

2. Ishares U.S. Regional Bank ETF

3. The leading bank mutual fund and/or ETF

For any questions or inquiries please email me @ alleywayinvesting@gmail.com.

The Interest Rate Equities Project

An Introduction

This next project is an ongoing one that will be revisited and reevaluated after the investment horizon is met. The idea behind this project deals with the Federal Reserve desire to raise interest rates. This rise in interest rates, even a small increase, has impacts on global markets and economies. The rise in interest rates are in speculation of when they will be, but have been hinting at the end of 2015 or start of 2016. This project is an equities based section of a portfolio that could be resistant to interest rate rises and could extract a profit.

Economic Conditions

Economic conditions during this project must be monitored with great detail. These are the selected conditions that will be monitored.

  • Federal Funds
  • 6-month CDs
  • Currency Fluctuations
  • 10-year Treasury Bill
  • Inflation Indexed
  • AAA Corporate Bonds

A discussion on the importance of the selected conditions

Economic conditions should be monitored and treated with importance in any investment. This specific investment project will monitor the selected economic conditions in greater detail and importance. This is because of the nature of the project entails a specific economic instrument (the interest rate) and its past results carry a significant amount of reasoning into the investment project.

Federal Funds

The federal fund rate is an important indicator of the overall economy. It determines the level of highly regarded institutions rate on the borrowing of money from the Federal Reserve. This rate holds value because it tends to control the rate of interest for borrowers throughout the economy. When this rate rises, banks are forced to raise the interest on their loans in order to combat the price they pay from the Federal Reserve.

6-month CDs

A 6-month CD is an alternative investment to equities and could bear a higher interest during interest rate rises based on the fact commercial banks will have to pay more to borrow from other banks to compete with the Federal Reserve rate. 6-months may be the horizon for the project (which will be decided based on the planned Federal Reserve’s rate increase) also could be used as a basis or a benchmark depending on whether or not CDs be a leading rate of return.

Currency Fluctuations

The specific currency rate that I will be taking close note of is the euro to the dollar. With interest rates rising, the dollar would appreciate against the euro, which could hurt multi-national corporations in the states.

10-Year Treasury Bill

The 10-year treasury bill are important to economists because it is a large determinant of investor confidence. The 10-year is regarded as one of the safest investment vehicles to invest in throughout the U.S. and perhaps the world markets. Uncertainty in the market could cause a higher demand for treasury notes.

 Inflation Indexed

The inflation index kept track by CPI numbers among other indicators, is an important measure the Federal Reserve will keep track of when raising interest rates. With inflation near 0 a healthier rate is looked at between 1-2%.

AAA Corporate Bonds

AAA corporate bonds will be a selected condition from Moody’s credit rating service because they are at historically low interest rate. This has created an unusual situation since interest rates and bonds tend to go inversely of each other. Moody’s AAA bond interest rates will be watched as a cautionary measure of corporate bond yields as an alternative investment.

Selected Economic Data

Federal Funds Rate

interest rate pic 1Source federalreserve.org

6-Month CDs

interest rate pic 2 Source: bankrate.com

Currency Fluctuations (Euro-Dollar Exchange)

interest rate 3 Source: federalreserve.org

 10-Year Treasury Yield

interest rate pic 4Source: federalreserve.org

 Inflation Indexed

interest rate pic 5Source: federalreserve.org

AAA Corporate Bonds

 interest rate pic 7Source: federalreserve.org

Equity Screening and Analysis & Reasoning

Based on the selected economic conditions above, as well as fundamental and performance-based analysis, an equity screening and analysis took place.

Sector Specific Screening

Based on the economic conditions that I have selected, along with the Fed’s forecast of a rise in interest rates, the general consensus is investing in financial institutions as the key sector during this economic time. With the raise in interest rates effecting banks, I am filtering equities based on the financial industry. I am not comfortable investing in financial institutions, especially after the financial collapse and the inaccuracy of reports coming from the financial industry makes the screening process increasingly difficult. I chose the financial industry based on the direct impact interest rates have on the industry. Using the selected economic data I found banks benefiting and profiting from a rise in interest rates and therefore an important sector for this project.

Federal Funds Rate

The Federal funds rate is at a historic low. Although the interest rate hike may not be as much of a hike instead of a slight hill, the rate rising still (as discussed in the selected economic conditions section) will cause banks to charge higher interest on their loans. This may (even if a small rise) be a gain for banks. Because of my major precaution against financial institutions with poor financial reports and the 2008 financial crisis, I tried to stay away from banks that hold heavy investments in real estate or mortgage backed securities.

Currency Fluctuations

As previously stated in the selected economic conditions, currency fluctuations affect multinational corporations in the states. So, I can effectively narrow down my search to financial institutions least effected by currency fluctuations. This search would come down to domestic regional banks.

Fundamental Screening

Criteria

-Mid-Large Capitalization

– Trailing PE ratio >20

– Regional Banks

– 0-10% Short Interest

– Net Profit Margin between 10-30%

Holdings

MTB                                                                                        M&T Bank Corporation

BBT                                                                                         BB&T Corporation

CBSH                                                                                       Commerce Bancshares Inc.

PRU                                                                                         Prudential Financial Inc.

RF                                                                                            Regional Financial Corporation

MMC                                                                                       Marsh & McLennan Companies

PFBC                                                                                       Preferred Bank

EWBC                                                                                     East West Bankcorp Inc.

ALL                                                                                          All State Corporation

Exceptions to the Fundamental Screening

PRU

EWBC

ALL

Short Explanation of Screening

I prefer to invest in companies with lower P/E ratios, middle to larger capitalization companies, (although not too large to be effected by currency fluctuations) minimal short interest, and net profit be sustainable to at least 20% and ideally above 25% among other screening criteria.

Prudential Financial Inc.

Prudential is an exception based on its in depth financial reports and value in this equity portfolio. I would consider Prudential as part of the project although it is not a bank; insurances tend to gain in cash flow during interest rate moves. Holding this type of large cap stock also makes its movements within certain ranges more predictable, making its risk lesser compared to mid capitalization companies. It also has a good quarterly earnings growth.

East West Bankcorp Inc.

East West Bankcorp didn’t meet my criteria for net profit margin, but has dividend growth, Schwab A equity rating, and is primarily a regional bank with lending services.

A Suggested Primitive Portfolio Allocation

interest rate 8

Selling Period

I emphasize selling a security being much harder than buying one. The selling period for this project will not be clear-cut until interest rates move upward. Once they do the market reaction and Fed minutes will be reviewed and a selling period will be revised based on the reaction of the markets and the Federal Reserve. A tentative selling period would be 1 quarter after interest rates are raised, also based on each holding’s earnings. Although if economic data still shows financials being a preferred after 1 quarter of interest rate levels rising, a new selling period may be re-examined. This project could be adapt for long-term positioning with appropriate dividend payouts be each company.

Summary

This project will be an ongoing endeavor and will be updated when deemed appropriate. This is an investment project taking into account interest rate levels changing and preparing a portion of an overall portfolio for interest rate levels rising with exposure to equities that may be adapt to a new interest rate level environment. Economic data will be monitored throughout this project from the Federal Reserve, Statistical Abstract of the United States, Board of Governors of the Federal Reserve System, and 2015 FOMC meeting statements and minutes.

2015 Portfolio Management and Security Analysis Investment Project

Introduction

This is a second semester financial project through interactive brokers class in portfolio management and security analysis with professor Marie-Eve Lachance of San Diego State University. The project was given out as a typical weighted 30 stock portfolio where the inspiration came from Motif Investing. Being familiar with Motif Investing helped me conceptualize the purpose and inspiration that was an intended learning target by professor Lachance. The learning target was to customize weighting for a 30 stock portfolio, trade the stocks in interactive brokers over a horizon of 2 months, and report back to the class over a risk adjusted weighted average. The competition was against the risk-adjusted return, benchmark of the S&P 500, as well as the students within the class.

I diverted from the primary objective of the project and experimented with a different investment structure. I quite simply felt a 30 stock portfolio was too time consuming (This project was assigned and involved in Professor Lachance’s portfolio management and security analysis class, an M.B.A class and as an undergraduate first year I did not simply have enough time allocation to develop a 30 stock portfolio strategy). I also felt the 30 stock portfolio was too diversified, and in order to achieve maximum profit with the amount of time invested, I would concentrate my portfolio structure.

The capital for the project was provided by interactive broker’s paper money account of $1,000,000. The horizon was approximately between February 13th, 2015 and April 13th 2015. Although I had familiarity with Motif Investing I did not use the interface as inspiration for my investment strategy. But instead assessed the economic conditions and the horizon that contributed greatly to my investment strategy. I figured an investment strategy that was heavily concentrated and was allocated simply. This strategy was thought upon because of my time allocation to the project, the horizon of the project, and the economic conditions of the horizon.

Strategy

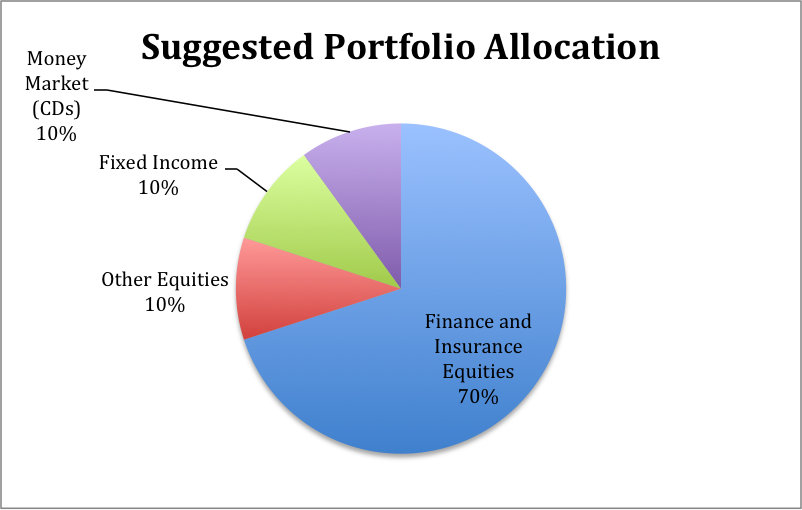
The strategy contained a heavy concentration of 6 allocated investment vehicles. The 6 securities were chosen based on pure percentages. The allocation went as follows:

50%                                                                                         Investment Vehicle

25%                                                                                         Investment Vehicle

11.3%                                                                                      ETF or Investment Vehicle

5%                                                                                           Low Risk Management

5%                                                                                           High Risk Management

3.7%                                                                                        Money Market (Cash)

This completely different investment structure goes against the 30 stock portfolio that was mentioned by Professor Lachance in class, but instead fits my primary objectives and time allocation. The primary objective of this structure made it easier for me to research for security selection, as well as increased my probability to obtain a maximum profit, the economic conditions I concluded felt suitable for this strategy during the duration of the horizon.

What was not foreseen was the risk-adjusted average at the end of the competition. I assessed the primary objectives and my personal time allocation wisely, but foresaw the risk-adjusted return that is weighted in at the end of the competition. Because of my concentrated investment strategy pursued maximum profit, it depending on the security selection, also obtained a higher than average risk.

Purpose

The purpose of this strategy was to maximize profit with my time allocation I put forth to the project. I bear in mind with a more substantial investment of my time this strategy would have been scrutinized, analyzed, and thought over more carefully and would have been altered. I was quite pleased with how this strategy worked out and with minor exceptions and mistakes with the time I put forth I felt as if this strategy achieved the purpose. I obviously altered the guidelines to the project that tailored to my primary objectives and time allocation. I have also presented the purpose of this paper to provide clarity to my investment project and give my track record out to public domain. I also acknowledge that this project was done with virtual money, which does not factor in certain incentives and psychological effects that is dealt with managing meaningful currency. Although I tend to find managing virtual money and actual money indifferent in a perfect scenario, since psychological effects should be minimized and incentives should be maintained.

Security Analysis

This section I will provide clarity to the security selection process as well as my holdings throughout this project. Keep in mind I will not be providing the percentages of the portfolio in which each security held, but instead will provide a list of the securities. The following list contains the securities that were held throughout this project.

ABX                                        Barricks Gold Corp.

BKS                                         Barnes N Noble

BRK B                                     Berkshire Hathaway

COST                                      Cosco

DG                                          Dollar General

FINL                                       Finish Line

GME                                       Game Stop

GREK                                     Greek 20 (ETF)

HABT                                      Habit Restaurants

HAL                                        Halliburton

HIBB                                       Hibbert Sports

JACK                                       Jack n the Box

KEYS                                      Keysight Technologies

LULU                                     Lululemon Athletica

M                                             Macy’s

PZA                                        Powershares Municipal Bond (ETF)

RES                                         RPC Inc.

SWKS                                     Skyworks Inc.

UA                                          Under Armor

WTW                                      Weight Watchers

The first acknowledgment that will be made upon the list will be the fact that there are well more than 6 securities listed. The structure that was created made it easily movable to go from one security to another. The way these securities were chosen were based off of multiple factors. One major investment style that contributed to this security selection was the combination of current events as well as quarterly earnings. Another investment style that resulted in this security selection was another combination of fundamental analysis and Benjamin Graham’s value investing. I used the same intuition that was in Benjamin Graham’sSecurity Analysis and historical pricing measurements. The movements between securities were based on the event driven investment style and were mostly the top 3 major holdings (50%, 25%, and 11.3% respectively). While the bottom 3 minor holdings (5%, 5%, and 3.7%) were traded lighter. The movements between holdings were on a daily and weekly basis again based on event driven investment techniques.

Data Analysis

The following section will analyze the data on a basis of trade volume throughout the portfolio to analyze and back selected security movement. Because of the high trade volume that incurred throughout the 2-month horizon, each trade will not be analyzed. The following data is provided through the first week of trading: February 13th – February 20th

Symbol                S/T  R                  S/T UN                  Loss                      Total                       Total

ABX 3,952.47 19,110.69 0.00 19,110.69 23,063.16
GREK 0.00 14,867.00 0.00 14,867.00 14,867.00
HAL 0.00 544.26 0.00 544.26 544.26
JACK 46,229.56 0.00 0.00 0.00 46,229.56
PZA 0.00 0.00 -103.00 -103.00 -103.00
SWKS 0.00 1,292.00 0.00 1,292.00 1,292.00
Total 50,182.03 35,813.95 -103.00 35,710.94 85,892.98

Data shows returns (realized and unrealized) and losses.

Over the first week of trading after I readjusted my securities to fit in the weights of the portfolio structure, I was pleased to find a successful time weighted rate of return of 7.42%. According to historical prices list of the S&P 500 the index gained 1% during the week (Yahoo Finance). As a majority of the equities traded were based off of event driven quarterly earnings, outliers were present in my security selection. For instance, Barricks Gold Corp. (Ticker: ABX) was held as one of my significant holdings at the beginning of the project but then was reduced to an slightly minor holding. Barricks Gold Corp. was chosen as a way to invest in the commodity gold. The company has posted negative earnings per share (which Graham would have frowned upon me taking a position in) but I went against Graham’s teachings in an investment in higher gold prices, plus a main weakness in Barricks Gold Corp. was their long standing debt, which is not owed for another 3 years, making the stock an ideal short term candidate to invest in for a gold position. Although going against Graham’s judgment may have paid off over the first week or so period of the project, Graham prevailed as gold prices turned. Again according to Yahoo Finance, Barricks Gold Corp. slid 7.4% during my duration of investment (which will be seen in later data sets). Although a profit was made on the holding when I reduced ABX to a minor holding of the portfolio, and realized profit was gained on the security during the weight shift. The weights of the securities in my portfolio were estimated and the exact weighting could have fluctuated during the investment period.

JACK 46,229.56 0.00 0.00 0.00 46,229.56

Although within my security selection process, there were outliers that performed exceedingly well. Jack in the Box was bought a day before earnings and held a significant weight in my portfolio. I spotted news articles of expansion in sales and with stores. Along with declining McDonald’s revenue, Jack in the Box was poised to steal the market share away. Which was the intuition behind the Jack in the Box trade.

The next data set will be presented from the dates between February 20thto March 6th. The roughly 2 weeks of trading that took place saw mixed results. Although the overall portfolio fell and cut into the earnings significantly, with a time weighted return of -3.59%. Compared with the S&P 500 average of -1.25% during the same time period (Yahoo Finance).

ABX 0.00 -12,118.26 -12,118.26 0.00 0.00 -12,118.26
BKS 0.00 0.00 0.00 -473.40 3,874.07 3,874.07
COST 0.00 0.00 0.00 0.00 494.92 494.92
GREK 10,863.50 0.00 10,863.50 0.00 0.00 10,863.50
HAL 0.00 -874.09 -874.09 0.00 0.00 -874.09
M 0.00 -15,219.06 -15,219.06 0.00 0.00 -15,219.06
PZA 0.00 0.00 0.00 -250.86 -250.86 -250.86
RES 0.00 0.00 0.00 -2,882.25 -2,882.25 -2,882.25
SWKS 0.00 0.00 0.00 0.00 5,213.60 5,213.60
WTW 0.00 -6,817.16 -6,817.16 0.00 0.00 -6,817.16
Total 10,863.50 -35,028.57 -24,165.07 -3,606.51 6,449.48 -17,715.59

S/T  R         S/T Loss           Total              Loss                 Total                       Total

In an explanation of the data, the realized profit was $10,863.50 while realized losses were $35,028.57. The total first column shows realized losses, the total second column shows unrealized gains, and the final total column is the result of unrealized and realized profit (losses). These two weeks of trading highlighted benefits as well as problems with the structure I set up for the portfolio. Since securities are moved on roughly a daily to weekly basis, constant decision making into investments of large proportions being made. To point out, Macy’s was an example of this decision-making format based off of event driven and intuition. I bought Macy’s on the eve of its earnings report, expecting it to beat a heavily negative analyzed earnings report. A consumer list was presented with expected earnings adjustments leading up to Macy’s earnings report, and out of the each consumer company, Macy’s earnings expected to be hit the most. I realized this added risk into my investment decision in hopes of a positive surprise in earnings reactions. This was not the case, Macy’s may have beat in revenue, but sited a weaker outlook and currency issues to come. Currency issues will be cited in the economic conditions report.

Before leaving this data set I do want to remind the reader of a positive trade that involved an ETF tracking the Athens Stock Exchange and essentially was to me a great way to trade Greece news. The timing of the trades was based on news reports of a Greek bailout that was flooding financial media outlets. Instead of trading a direct source of a Greek bailout, which would be considered the Bank of Athens which reacted more strongly on the news of the Greece elections and bailout, I chose to follow the Athens Stock Exchange based on the reasoning of diversity the Athens Stock Exchange carried, essentially lowering risk on an already risky topic. This trade carried important timing to it because of how volatile the situation was and still currently is, although with the Greece elections and optimism in the air, I felt an opportunity to capitalize.

A Cold March

I will not be presenting the data for the rest of March but will summarize the performance and investing mistakes that were made. From March 2nd to March 31st my portfolio lost 5.27%. Still overall presenting a gain of 2.26%, the month of March presented a challenge and I found through data analysis, my investment mistakes made. In a comparison, the S&P 500 lost 1.77% during the same period (Yahoo Finance). This month foresaw the fall of the gold prices, and realized the loses I endured taking up an investment in Barricks Gold Corp. Barricks Gold Corp. lost 16% in the month of March, and with the portfolio structure that I created, a concentrated amount of the portfolio was critically hit by this security. Thankfully, there were some trades that cushioned the losses that the month of March endured. I will present more in my acknowledgments section of what I have learned from this month of trading.

The following data piece will end our data analysis. The following positions were held from March 31st to April 13th the end of the project date.

BRK B 0.00 -275.18 -275.18
FINL 8,509.67 0.00 8,509.67
KEYS 0.00 -2,500.22 -2,500.22
LULU 2,591.83 0.00 2,591.83
RES 6,677.07 0.00 6,677.07
UA 9,816.22 0.00 9,816.22
Total 27,594.79 -2,775.41 24,819.39

S/T Profit                                     S/T Loss                             Total

All Profits/Losses are realized at the end of the project date (April 13th). The last remaining 2 weeks were able to recover from some of the losses endured in March and through the first half of April a time weighted return was 2.85% for the portfolio. This period was abnormal in the sense the activity or movement of positions was relatively light. Since the money market (cash) positions fluctuated during this period, less risk was taken throughout the portfolio and larger more consistent profits were taken.

Economic Conditions

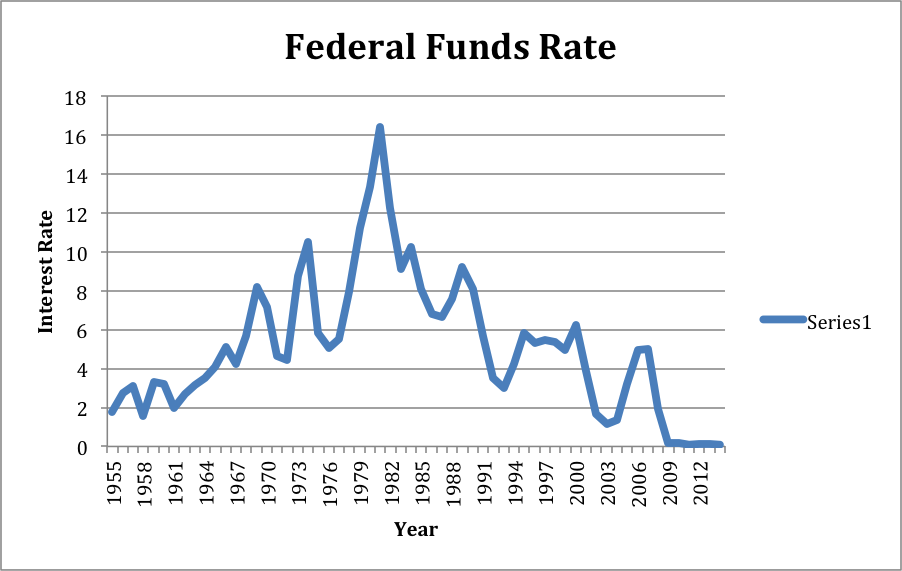
Economic conditions were carefully monitored throughout this project from a majorly macroeconomic standpoint. As this earnings period was summarized by the quote “stocks will have to earn their way now.” Stating the easy money by the Federal Reserve’s quantitative easing program was fully gone, and interest rate scares were flaring and continue to be a hot topic for the next few quarters.

Although a jobs report in March was reported well below the expectations, causing questions to be raised regarding the state of the economy. Janet Yellen the chairwomen of the Federal Reserve removed the key word ‘patience’ from Federal Reserve minutes causing questions in an interest rate hike, although with the economic data that they are heavily monitoring coming in more cautious than expected in March, a hard look will be taken on whether a hike will be coming in Q4 or Q1 of 2016.

A key economic factor that caused a more cautious earnings season was caused on the volatility of the oil and currency markets. Multinational companies were hit on currency rates volatility and the strengthened dollar. The volatile oil sector (which I tried to play) did not contribute to economic gains as I expected, especially in the consumer industry. Many corporations primarily blamed the currency fluctuations to poor earnings.

In a conclusion of primarily macroeconomic conditions, the equity market was a preferred asset class to invest in during this project based on small economic growth, and a cautious Federal Reserve based on international markets with the oil industry, and volatile currencies being barriers to higher returns.

Acknowledgments

In this section I will go over my mistakes and accuracies during this project and learn from both. I will not be going over every mistake extensively, but instead through the analysis portion I will be summarizing common characteristics found throughout my mistakes as well as accuracies.

Mistakes

Barricks Gold Corp. was an investment mistake in a number of ways. Although it had stints of gains, the stock overall during my investment period was negative. I did realize that investing in gold was a lost cause and minimized its weighting in the portfolio, creating a loss minimization. The mistakes that I realized are the fundamentals, Barricks Gold Corp. does not pass Benjamin Graham’s value principles or fundamental analysis. It has long standing debt and negative earnings. A strong dollar does not help the company’s profits either.

Barnes & Noble was also an investment mistake in a very elementary way. I positioned a heavy weighting of Barnes & Noble 2 weeks before earnings, believing a surprise in sales in its online and nook sales. To my surprise Barnes & Noble released a day after my positioning their firm stance in keeping their nook section of their business allowing the stock to move higher on heavy trading. I kept my positioning in the company, not taking any profits on the belief of still being able to profit from an earnings release. This intuition was not correct and instead investors felt Barnes & Noble was overvalued and sold off after the earnings, causing an overall loss for my investment. The lesson I learned is to take profits and adjust targets and investing positioning’s on an agile basis. I should have been sufficient on the gains that came when they released positive news the day before.

Macy’s was a pure miss. I realized this investment was riskier than it needed to be and instead did not profit from what I believed would have been better earnings from the consumer staples. Out of all the retailers I realized Macy’s was on the lower end of expectations compared with others, I felt that retailers could benefit from a lower oil price and due to that intuition and some slight technical analysis I simply positioned myself in the wrong retailer, while other retailers that were on my watch list benefited from their earnings.

Support (Accuracies)

Dollar General reported Q4 earnings on March 12th and I took a large position into Dollar General before earnings release. Dollar General is a discount retailer that has been benefiting on a weak economy, I felt my intuition for Macy’s played a role in Dollar General, although a difference that is key was the fact that Macy’s was a higher end retailer while Dollar General are more discount retailers. The company rose on nice year over year growth according to its earnings and shortly sold my profits, accomplishing my investment objective.

My Greek exchange traded fund has been explained in detail during my analysis section, but in summary, my intuition and following of current events surrounding the Greece elections and bailout situation, I felt an opportunity if carefully timed, could be made to profit on this situation.

Jack in the Box was my first trade that I bought before its earnings report. Again I explained this buy in my analysis section but in short I felt that Jack in the Box was expanding and able to grab a larger market share in the fast-food industry. I completed my investment objective and sold Jack in the Box after the reaction to its earnings release.

Under Armor I bought after a release of consumer goods data that showed a gain throughout the sector and believed Under Armor would benefit from good consumer goods data. CEO Kevin Plank also got publicity by calling out Nike and Adidas, and the short-term publicity and high call/put ratio created a buying opportunity.

Conclusion

In a conclusion of my 2015 Portfolio Management and Security Analysis Investment Project I analyzed and explained my investment strategy, security process, security analysis, and came out with an overall return of 4.6% beating the S&P 500 return of .17% by 4.43%. Although I am pleased with my results, I realize there is much to be learned, better performances I can pursuit by allocating more time to my investment projects. I have also another track record up on my blog Alleyway Investing at http://www.alleywayinvesting.blogspot.com that shows stock watch lists of the year and their returns at the end of the year. I enjoyed this investment project and have planned more for the future.